


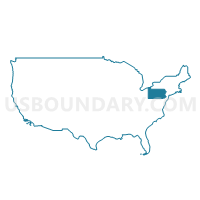
State Senate District 32, Pennsylvania
About
Outline

Summary
| Unique Area Identifier | 201306 |
| Name | State Senate District 32 |
| State | Pennsylvania |
| Area (square miles) | 1,948.90 |
| Land Area (square miles) | 1,934.00 |
| Water Area (square miles) | 14.90 |
| % of Land Area | 99.24 |
| % of Water Area | 0.76 |
| Latitude of the Internal Point | 39.95496540 |
| Longtitude of the Internal Point | -79.30997420 |
| Total Population | 225,580 |
| Total Housing Units | 106,233 |
| Total Households | 91,274 |
| Median Age | 43.2 |
Maps

Graphs
Select a template below for downloading or customizing gragh for State Senate District 32, Pennsylvania


Neighbors
Neighoring State Legislative District Upper Chamber (by Name) Neighboring State Legislative District Upper Chamber on the Map
- State Senate District 1, MD
- State Senate District 13, WV
- State Senate District 14, WV
- State Senate District 30, PA
- State Senate District 35, PA
- State Senate District 39, PA
- State Senate District 41, PA
- State Senate District 46, PA
Top 10 Neighboring County (by Population) Neighboring County on the Map
- Westmoreland County, PA (365,169)
- Washington County, PA (207,820)
- Cambria County, PA (143,679)
- Fayette County, PA (136,606)
- Monongalia County, WV (96,189)
- Somerset County, PA (77,742)
- Allegany County, MD (75,087)
- Bedford County, PA (49,762)
- Greene County, PA (38,686)
- Preston County, WV (33,520)
Top 10 Neighboring County Subdivision (by Population) Neighboring County Subdivision on the Map
- Eastern district, Monongalia County, WV (39,767)
- Western district, Monongalia County, WV (27,045)
- Unity township, Westmoreland County, PA (22,607)
- Richland township, Cambria County, PA (12,814)
- North Union township, Fayette County, PA (12,728)
- Somerset township, Somerset County, PA (12,122)
- Rostraver township, Westmoreland County, PA (11,363)
- Mount Pleasant township, Westmoreland County, PA (10,911)
- South Union township, Fayette County, PA (10,681)
- Uniontown city, Fayette County, PA (10,372)
Top 10 Neighboring Place (by Population) Neighboring Place on the Map
- Uniontown city, PA (10,372)
- Cheat Lake CDP, WV (7,988)
- Connellsville city, PA (7,637)
- California borough, PA (6,795)
- Somerset borough, PA (6,277)
- Scottdale borough, PA (4,384)
- Windber borough, PA (4,138)
- Charleroi borough, PA (4,120)
- Masontown borough, PA (3,450)
- Centerville borough, PA (3,263)
Top 10 Neighboring Unified School District (by Population) Neighboring Unified School District on the Map
- Monongalia School District, WV (96,189)
- Allegany County Public Schools, MD (75,087)
- Connellsville Area School District, PA (34,494)
- Preston County School District, WV (33,520)
- Greater Latrobe School District, PA (31,271)
- Garrett County Public Schools, MD (30,097)
- Albert Gallatin Area School District, PA (23,880)
- Uniontown Area School District, PA (23,820)
- Laurel Highlands School District, PA (23,409)
- Somerset Area School District, PA (21,327)
Top 10 Neighboring State Legislative District Lower Chamber (by Population) Neighboring State Legislative District Lower Chamber on the Map
- State House District 44, WV (89,802)
- State House District 59, PA (61,834)
- State House District 55, PA (60,812)
- State House District 78, PA (60,809)
- State House District 58, PA (59,656)
- State House District 50, PA (59,028)
- State House District 69, PA (58,411)
- State House District 49, PA (58,268)
- State House District 72, PA (58,097)
- State House District 52, PA (56,814)
Top 10 Neighboring 111th Congressional District (by Population) Neighboring 111th Congressional District on the Map
- Congressional District 6, MD (738,943)
- Congressional District 9, PA (666,810)
- Congressional District 18, PA (653,385)
- Congressional District 1, WV (615,991)
- Congressional District 12, PA (612,384)
Top 10 Neighboring Census Tract (by Population) Neighboring Census Tract on the Map
- Census Tract 2628, Fayette County, PA (7,128)
- Census Tract 9701, Greene County, PA (7,106)
- Census Tract 9638, Preston County, WV (6,763)
- Census Tract 2613, Fayette County, PA (6,648)
- Census Tract 2605, Fayette County, PA (6,519)
- Census Tract 208, Somerset County, PA (6,230)
- Census Tract 206, Somerset County, PA (6,094)
- Census Tract 133, Cambria County, PA (5,972)
- Census Tract 209, Somerset County, PA (5,892)
- Census Tract 2631, Fayette County, PA (5,871)
Top 10 Neighboring 5-Digit ZIP Code Tabulation Area (by Population) Neighboring 5-Digit ZIP Code Tabulation Area on the Map
- 15401, PA (32,288)
- 26508, WV (29,170)
- 15650, PA (28,432)
- 15905, PA (21,226)
- 15425, PA (19,270)
- 15501, PA (16,861)
- 15904, PA (16,608)
- 15666, PA (16,461)
- 15012, PA (15,905)
- 21532, MD (15,620)
Data
Demographic, Population, Households, and Housing Units
** Data sources from census 2010 **
Show Data on Map
Download Full List as CSV
Download Quick Sheet as CSV
| Subject | This Area | Pennsylvania | National |
|---|---|---|---|
| POPULATION | |||
| Total Population Map | 225,580 | 12,702,379 | 308,745,538 |
| POPULATION, HISPANIC OR LATINO ORIGIN | |||
| Not Hispanic or Latino Map | 223,531 | 11,982,719 | 258,267,944 |
| Hispanic or Latino Map | 2,049 | 719,660 | 50,477,594 |
| POPULATION, RACE | |||
| White alone Map | 212,117 | 10,406,288 | 223,553,265 |
| Black or African American alone Map | 8,933 | 1,377,689 | 38,929,319 |
| American Indian and Alaska Native alone Map | 291 | 26,843 | 2,932,248 |
| Asian alone Map | 717 | 349,088 | 14,674,252 |
| Native Hawaiian and Other Pacific Islander alone Map | 43 | 3,653 | 540,013 |
| Some Other Race alone Map | 911 | 300,983 | 19,107,368 |
| Two or More Races Map | 2,568 | 237,835 | 9,009,073 |
| POPULATION, SEX | |||
| Male Map | 112,456 | 6,190,363 | 151,781,326 |
| Female Map | 113,124 | 6,512,016 | 156,964,212 |
| POPULATION, AGE (18 YEARS) | |||
| 18 years and over Map | 181,434 | 9,910,224 | 234,564,071 |
| Under 18 years | 44,146 | 2,792,155 | 74,181,467 |
| POPULATION, AGE | |||
| Under 5 years | 10,874 | 729,538 | 20,201,362 |
| 5 to 9 years | 11,820 | 753,635 | 20,348,657 |
| 10 to 14 years | 13,024 | 791,151 | 20,677,194 |
| 15 to 17 years | 8,428 | 517,831 | 12,954,254 |
| 18 and 19 years | 6,265 | 387,235 | 9,086,089 |
| 20 years | 3,302 | 191,942 | 4,519,129 |
| 21 years | 3,178 | 183,257 | 4,354,294 |
| 22 to 24 years | 7,915 | 498,947 | 12,712,576 |
| 25 to 29 years | 12,160 | 781,527 | 21,101,849 |
| 30 to 34 years | 12,397 | 729,592 | 19,962,099 |
| 35 to 39 years | 13,900 | 764,287 | 20,179,642 |
| 40 to 44 years | 15,098 | 851,382 | 20,890,964 |
| 45 to 49 years | 16,617 | 955,763 | 22,708,591 |
| 50 to 54 years | 18,239 | 984,641 | 22,298,125 |
| 55 to 59 years | 17,426 | 879,048 | 19,664,805 |
| 60 and 61 years | 6,338 | 312,575 | 7,113,727 |
| 62 to 64 years | 8,518 | 430,721 | 9,704,197 |
| 65 and 66 years | 4,565 | 231,623 | 5,319,902 |
| 67 to 69 years | 6,599 | 321,379 | 7,115,361 |
| 70 to 74 years | 8,914 | 426,536 | 9,278,166 |
| 75 to 79 years | 7,236 | 362,332 | 7,317,795 |
| 80 to 84 years | 6,525 | 311,761 | 5,743,327 |
| 85 years and over | 6,242 | 305,676 | 5,493,433 |
| MEDIAN AGE BY SEX | |||
| Both sexes Map | 43.20 | 40.10 | 37.20 |
| Male Map | 41.50 | 38.70 | 35.80 |
| Female Map | 44.90 | 41.50 | 38.50 |
| HOUSEHOLDS | |||
| Total Households Map | 91,274 | 5,018,904 | 116,716,292 |
| HOUSEHOLDS, HOUSEHOLD TYPE | |||
| Family households: Map | 59,911 | 3,261,307 | 77,538,296 |
| Husband-wife family Map | 45,043 | 2,417,765 | 56,510,377 |
| Other family: Map | 14,868 | 843,542 | 21,027,919 |
| Male householder, no wife present Map | 4,374 | 229,495 | 5,777,570 |
| Female householder, no husband present Map | 10,494 | 614,047 | 15,250,349 |
| Nonfamily households: Map | 31,363 | 1,757,597 | 39,177,996 |
| Householder living alone Map | 26,551 | 1,433,415 | 31,204,909 |
| Householder not living alone Map | 4,812 | 324,182 | 7,973,087 |
| HOUSEHOLDS, HISPANIC OR LATINO ORIGIN OF HOUSEHOLDER | |||
| Not Hispanic or Latino householder: Map | 90,875 | 4,823,358 | 103,254,926 |
| Hispanic or Latino householder: Map | 399 | 195,546 | 13,461,366 |
| HOUSEHOLDS, RACE OF HOUSEHOLDER | |||
| Householder who is White alone | 87,891 | 4,264,337 | 89,754,352 |
| Householder who is Black or African American alone | 2,408 | 498,966 | 14,129,983 |
| Householder who is American Indian and Alaska Native alone | 136 | 9,573 | 939,707 |
| Householder who is Asian alone | 199 | 109,060 | 4,632,164 |
| Householder who is Native Hawaiian and Other Pacific Islander alone | 9 | 1,127 | 143,932 |
| Householder who is Some Other Race alone | 66 | 82,237 | 4,916,427 |
| Householder who is Two or More Races | 565 | 53,604 | 2,199,727 |
| HOUSEHOLDS, HOUSEHOLD TYPE BY HOUSEHOLD SIZE | |||
| Family households: Map | 59,911 | 3,261,307 | 77,538,296 |
| 2-person household Map | 28,931 | 1,442,819 | 31,882,616 |
| 3-person household Map | 14,376 | 767,169 | 17,765,829 |
| 4-person household Map | 10,361 | 620,755 | 15,214,075 |
| 5-person household Map | 4,119 | 271,611 | 7,411,997 |
| 6-person household Map | 1,339 | 98,268 | 3,026,278 |
| 7-or-more-person household Map | 785 | 60,685 | 2,237,501 |
| Nonfamily households: Map | 31,363 | 1,757,597 | 39,177,996 |
| 1-person household Map | 26,551 | 1,433,415 | 31,204,909 |
| 2-person household Map | 3,953 | 262,684 | 6,360,012 |
| 3-person household Map | 465 | 36,955 | 992,156 |
| 4-person household Map | 303 | 16,687 | 411,171 |
| 5-person household Map | 64 | 4,799 | 126,634 |
| 6-person household Map | 11 | 1,720 | 48,421 |
| 7-or-more-person household Map | 16 | 1,337 | 34,693 |
| HOUSING UNITS | |||
| Total Housing Units Map | 106,233 | 5,567,315 | 131,704,730 |
| HOUSING UNITS, OCCUPANCY STATUS | |||
| Occupied Map | 91,274 | 5,018,904 | 116,716,292 |
| Vacant Map | 14,959 | 548,411 | 14,988,438 |
| HOUSING UNITS, OCCUPIED, TENURE | |||
| Owned with a mortgage or a loan Map | 34,067 | 2,268,674 | 52,979,430 |
| Owned free and clear Map | 32,266 | 1,223,048 | 23,006,644 |
| Renter occupied Map | 24,941 | 1,527,182 | 40,730,218 |
| HOUSING UNITS, VACANT, VACANCY STATUS | |||
| For rent Map | 2,255 | 135,262 | 4,137,567 |
| Rented, not occupied Map | 167 | 9,386 | 206,825 |
| For sale only Map | 1,064 | 64,818 | 1,896,796 |
| Sold, not occupied Map | 534 | 20,131 | 421,032 |
| For seasonal, recreational, or occasional use Map | 6,559 | 161,582 | 4,649,298 |
| For migrant workers Map | 13 | 411 | 24,161 |
| Other vacant Map | 4,367 | 156,821 | 3,652,759 |
| HOUSING UNITS, OCCUPIED, AVERAGE HOUSEHOLD SIZE BY TENURE | |||
| Total: Map | 2.35 | 2.45 | 2.58 |
| Owner occupied Map | 2.43 | 2.57 | 2.65 |
| Renter occupied Map | 2.14 | 2.16 | 2.44 |
| HOUSING UNITS, OCCUPIED, TENURE BY RACE OF HOUSEHOLDER | |||
| Owner occupied: Map | 66,333 | 3,491,722 | 75,986,074 |
| Householder who is White alone Map | 64,924 | 3,140,005 | 63,446,275 |
| Householder who is Black or African American alone Map | 900 | 228,851 | 6,261,464 |
| Householder who is American Indian and Alaska Native alone Map | 90 | 4,562 | 509,588 |
| Householder who is Asian alone Map | 125 | 62,204 | 2,688,861 |
| Householder who is Native Hawaiian and Other Pacific Islander alone Map | 4 | 544 | 61,911 |
| Householder who is Some Other Race alone Map | 21 | 30,761 | 1,975,817 |
| Householder who is Two or More Races Map | 269 | 24,795 | 1,042,158 |
| Renter occupied: Map | 24,941 | 1,527,182 | 40,730,218 |
| Householder who is White alone Map | 22,967 | 1,124,332 | 26,308,077 |
| Householder who is Black or African American alone Map | 1,508 | 270,115 | 7,868,519 |
| Householder who is American Indian and Alaska Native alone Map | 46 | 5,011 | 430,119 |
| Householder who is Asian alone Map | 74 | 46,856 | 1,943,303 |
| Householder who is Native Hawaiian and Other Pacific Islander alone Map | 5 | 583 | 82,021 |
| Householder who is Some Other Race alone Map | 45 | 51,476 | 2,940,610 |
| Householder who is Two or More Races Map | 296 | 28,809 | 1,157,569 |
| HOUSING UNITS, OCCUPIED, TENURE BY HISPANIC OR LATINO ORIGIN OF HOUSEHOLDER | |||
| Owner occupied: Map | 66,333 | 3,491,722 | 75,986,074 |
| Not Hispanic or Latino householder Map | 66,117 | 3,408,824 | 69,617,625 |
| Hispanic or Latino householder Map | 216 | 82,898 | 6,368,449 |
| Renter occupied: Map | 24,941 | 1,527,182 | 40,730,218 |
| Not Hispanic or Latino householder Map | 24,758 | 1,414,534 | 33,637,301 |
| Hispanic or Latino householder Map | 183 | 112,648 | 7,092,917 |
| HOUSING UNITS, OCCUPIED, TENURE BY HOUSEHOLD SIZE | |||
| Owner occupied: Map | 66,333 | 3,491,722 | 75,986,074 |
| 1-person household Map | 15,750 | 767,169 | 16,453,569 |
| 2-person household Map | 26,402 | 1,304,206 | 27,618,605 |
| 3-person household Map | 11,290 | 596,731 | 12,517,563 |
| 4-person household Map | 8,201 | 499,363 | 10,998,793 |
| 5-person household Map | 3,117 | 210,370 | 5,057,765 |
| 6-person household Map | 989 | 72,113 | 1,965,796 |
| 7-or-more-person household Map | 584 | 41,770 | 1,373,983 |
| Renter occupied: Map | 24,941 | 1,527,182 | 40,730,218 |
| 1-person household Map | 10,801 | 666,246 | 14,751,340 |
| 2-person household Map | 6,482 | 401,297 | 10,624,023 |
| 3-person household Map | 3,551 | 207,393 | 6,240,422 |
| 4-person household Map | 2,463 | 138,079 | 4,626,453 |
| 5-person household Map | 1,066 | 66,040 | 2,480,866 |
| 6-person household Map | 361 | 27,875 | 1,108,903 |
| 7-or-more-person household Map | 217 | 20,252 | 898,211 |
Loading...